From time to time your Logstash process may crash and you start seeing gaps on your Kibana graph (you graph logs and monitor those, right? ). That may also, coincidentally?, correlate with downtime you had 10 minutes ago.. So you need to replay missing events back into Logstash and figure out what happened. Or maybe you have some wired log file dated years ago and would want to analyze it using your awesome logging infrastructure ( and don’t want to pay for Splunk! ).

Well, it sort of easy to do with Logstash, but if it would be too obvious, I wouldn’t need to write about it! (the devil is in details, pay attention) 🙂
Basically you need to modify your shipper config and add tcp input and date filter. Here is the sample:
Note Date filter in the config, without it your old entries will get current @timestamp, wich may ruin the whole procedure and create duplicate entries!
According to filter documentation you should be able to use ISO8601 to parse dates in that format. It didn’t work for me, so I had to resort to the dirty date matching pattern (maybe that’s fixed in more recent versions).
Once you have new shipper config in place, restart shipper. Now the only remaining piece is to feed data back into Logstash.
Remember we created TCP input in the shipper confg? Because of it we can simply backfill data with something like cat nginx_access.log | nc localhost 3333
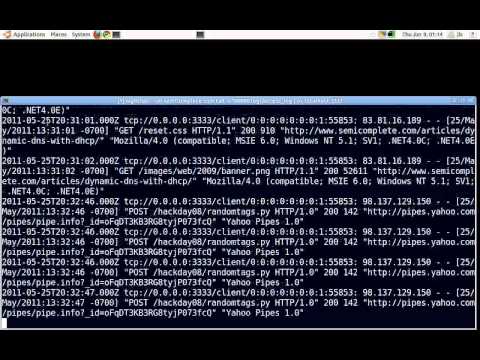
Here is also nice and short video if you prefer to watch the process:
P.S. Pay attention to the Date filter, otherwise wasted time is guaranteed!
Also published on Medium.
hello thanks for your post, do you know how can I do this on filebeat 6.1.1, thanks for your replay!